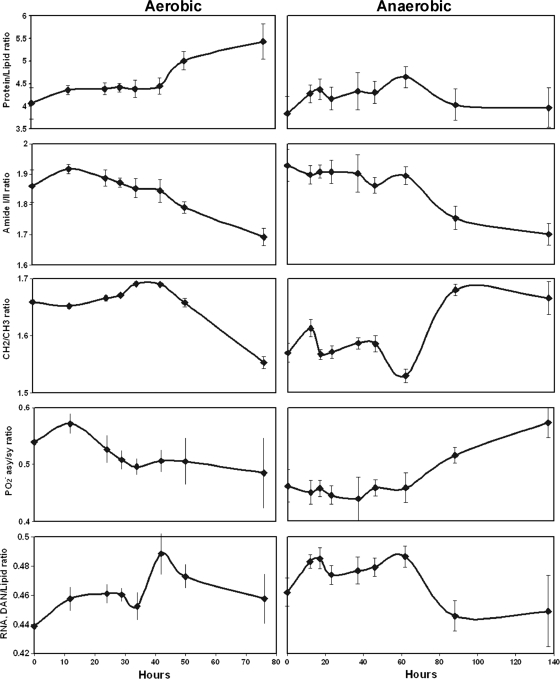
FIG. 5.
Quantitative analysis of the absorbance band areas of FT-IR spectra. Protein/lipid ratio, ratio of amide I and II area to lipid area; amide I/II ratio, ratio of band areas of amide I to amide II regions; CH2/CH3 ratio, ratio of band area of CH2 asymmetric/CH3 asymmetric; PO2− asy/sy ratio, ratio of band area of PO2− antisymmetric stretch to PO2− symmetric stretch; RNA, DNA/lipid content ratio, ratio of band area of RNA and DNA to band area of lipids. Points show the means of results from 3 measurements, and the standard deviation error bars are plotted.

