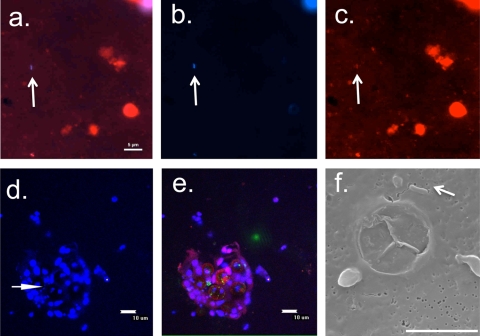
FIG. 3.
Representative images of P. lobata mucus treated with the trypsin protocol. (a to c) Single images of a mucus sample, each with an arrow pointing toward a bacterial cell (the scale bar is 5 μm). Epifluorescence images of a dual-stained sample showing red (NAO and chlorophyll) and blue (DAPI) channels overlaid (a), the blue channel alone (b), and the red channel alone (c). (d and e) Integrated three-dimensional stacks displayed in two dimensions of a single field of view taken with laser scanning confocal microscopy, with an arrow pointing toward several bacterial cells (the scale bar is 10 μm). (d) Blue channel shown from a laser scanning confocal image, showing the DAPI signal. The arrow points toward bacterial cells in a cluster of zooxanthella cells. (e) Red, green, and blue channels from the same image as shown in panel d, showing the autofluorescence detected in the red and green channels. (f) SEM image of a bacterium (arrow) in the mucus, with a 5-μm scale bar.

