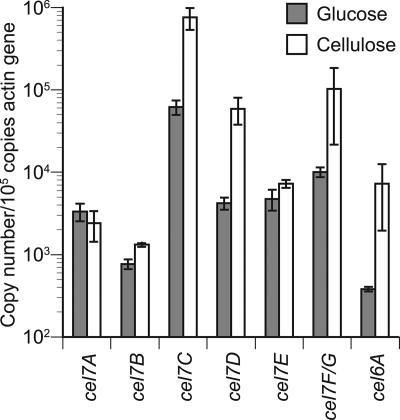
FIG. 1.
Copy numbers of cel7A to -F/G and cel6A transcripts quantified by real-time PCR in 2-day-old culture with 100 mM glucose or 2% cellulose as a carbon source. The vertical axis indicates the number of transcripts normalized with respect to 105 copies of actin gene transcripts in the same sample. Error bars show the standard deviation in triplicate tests.

