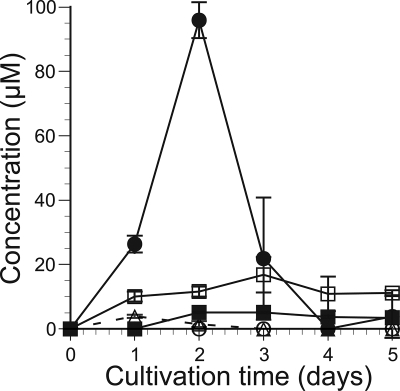
FIG. 3.
Concentrations of glucose and cellooligosaccharides in extracellular fluid from culture in 2% cellulose medium. The concentration was quantified by HPLC every 24 h for 5 days. Open squares, glucose; filled circles, cellobiose; open triangles, cellotriose; filled squares, cellotetraose; open circles, cellopentaose. Error bars show the standard deviation in triplicate tests.

