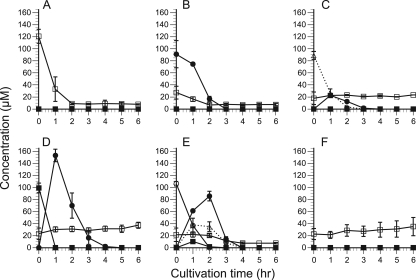
FIG. 4.
Time course of concentrations of glucose and cellooligosaccharides in extracellular fluid from 20 mM glycerol culture, supplemented with 100 μM glucose (A), cellobiose (B), cellotriose (C), cellotetraose (D), or cellopentaose (E) or with no addition as a control (F). The concentration was quantified by HPLC for 6 h after the addition of each sugar. Open squares, glucose; filled circles, cellobiose; open triangles, cellotriose; filled squares, cellotetraose; open circles, cellopentaose. Error bars show the standard deviation in triplicate tests.

