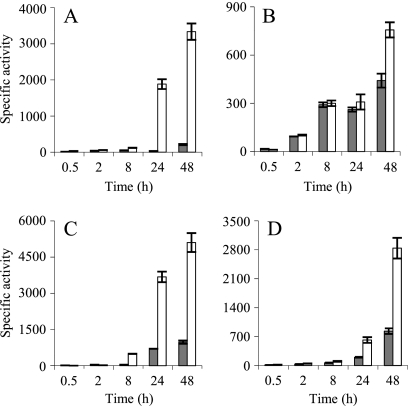
FIG. 8.
Expression of cus2 and cus3 in WT (gray columns) and ΔcopA ΔcopB (white columns) backgrounds during growth and development. (A and B) In the case of cus2, the expression was monitored by using 800 μM copper during growth (A), whereas 40 μM copper was added during development (B). (C and D) For cus3, 600 μM copper was used during growth (C), and 60 μM was used during development (D). The results are the averages of data from three different experiments. The error bars indicate standard deviations. Note the differences in the scales.

