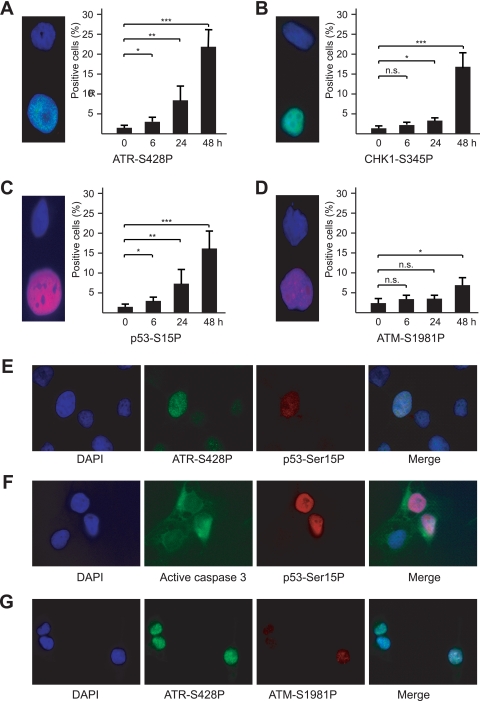
FIG. 7.
ATR response after induction of convergent transcription in DIT7 cells. (A) ATR-S428P; (B) CHK1-S345P; (C) p53-S15P; (D) ATM-S1981P. Individual proteins were assessed at 0, 6, 24, and 48 h by immunostaining. Micrographs show examples of cells that are negative (above) and positive (below). Results were averaged from three determinations, and error bars represent standard deviations. Statistical significance is indicated: n.s., not significant; *, P < 0.05; **, P < 0.001; and ***, P < 0.0001. (E) p53-S15P fluorescence in ATR-S428P-positive cells; (F) ATM-S1981P fluorescence in ATR-S428P-positive cells; (G) active caspase 3 fluorescence in p53-S15P-positive cells.

