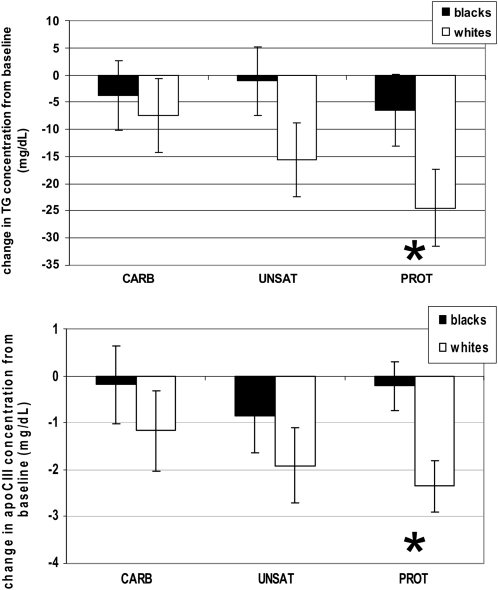
FIGURE 1.
Mean (±SEM) changes from baseline in plasma TG and apo C-III by diet in blacks and whites. The study diets reduced plasma triglyceride (TG) (top) and apolipoprotein (apo) C-III (bottom) in whites more than in blacks, after adjustment for baseline concentrations. Plasma TG: blacks, n = 57; whites, n = 50; plasma apo C-III: blacks, n = 59; whites, n = 56. *P for race < 0.05 in the linear regression model, adjusted for baseline plasma TG, sex, age, and site of recruitment, indicating that the differences from baseline differ significantly by race. CARB, carbohydrate diet; UNSAT, unsaturated fats diet; PROT, protein diet.

