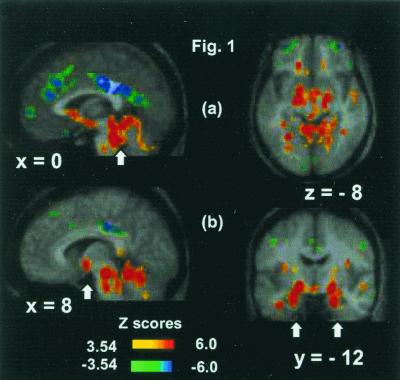
Figure 1.
Activations and deactivations for the CO2 FM scans compared with the O2 FM scans displayed on the average MR brain image of the nine subjects. (a) Extensive midbrain and brainstem activations (arrowed) (x = 0; z = −8), medial frontal and large posterior cingulate deactivations (x = 0), and bilateral middle frontal gyri deactivations (z = −8). (b) Hypothalamus (arrowed), brainstem, and cerebellum activations (x = 8), and highly significant bilateral amygdala activations (arrowed) (y = −12). The positive and negative Z-score color coding is shown.

