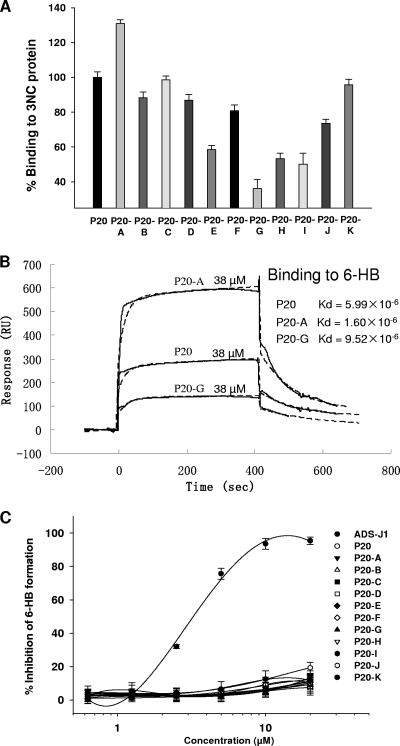
FIG. 7.
Biological analysis of P20 and its mutants. (A) Binding activity of P20 and its mutants to the gp41 6-HB core as measured by direct ELISA. (B) SPR analyses of P20 and its variants binding to the gp41 6-HB (3NC). The same amounts (38 μM) of P20 and its mutants were injected at a flow rate of 5 μl/min. Experimental curves (solid line) are overlaid with the fitted curves (dashed line) obtained with the 1:1 binding-with-drifting baseline model. (C) Assessment of inhibitory activities of P20 and its mutants on gp41 6-HB formation detected by sandwich ELISA.

