FIG. 2.
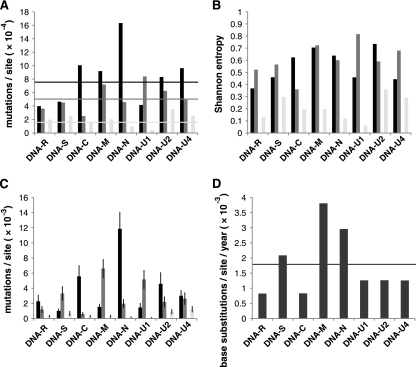
Variability and evolution rates of a field isolate and laboratory-propagated isolates of FBNSV. Mutation frequencies (A), genetic diversities (B), genetic distances (C), and substitution rates (D) of the eight individual genomic DNAs within each of the three FBNSV populations are shown as bar diagrams. Black, FBNSV-[ET:Hol;1997] (original field isolate); dark gray, FBNSV-[ET:Hol;JKI-2000] (laboratory-maintained population); light gray, FBNSV-[ET:Hol;ISV-T1] (bottleneck-derived population). Horizontal lines in panel A indicate the mutation frequencies of the entire FBNSV genome (average of those for the eight individual DNAs) in the respective three populations: 7.52 × 10⁻⁴ mutations/site for FBNSV-[ET:Hol;1997], 5.07 × 10⁻⁴ mutations/site for FBNSV-[ET:Hol;JKI-2000], and 1.66 × 10⁻⁴ mutations/site for the single-transfer FBNSV-[ET:Hol;ISV-T1] population. Error bars in panel C refer to standard deviations of the genetic distances. The horizontal line in panel D indicates the overall nucleotide substitution rate of FBNSV (1.78 × 10⁻³ substitutions/site/year). The data and numerical values used for calculations and graphic display are provided in Tables S2 and S3 in the supplemental material.

