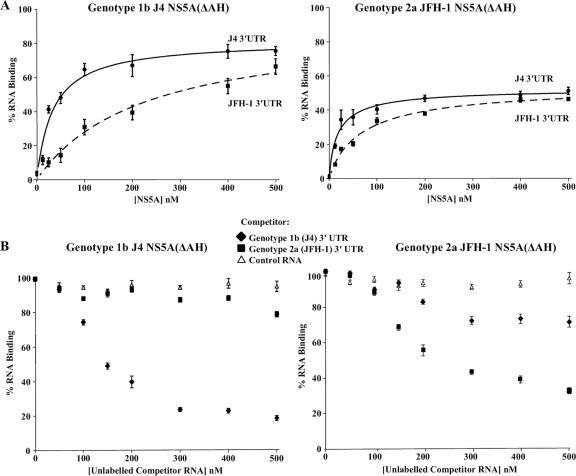
FIG. 4.
Filter binding analysis of the genotype specificity of the NS5A-3′ UTR interaction. (A) Purified NS5A(ΔAH) of genotype 1b (J4, left) or genotype 2a (JFH-1, right) was incubated with radiolabeled 3′ UTR RNA (1 nM) or either genotype 1b (J4, solid lines) or genotype 2a (JFH-1, dashed lines) and analyzed as described for Fig. 3. The percentage of RNA bound to the nitrocellulose membrane was quantified and plotted as a function of the NS5A concentration. The data were fitted to a hyperbolic equation. (B) Purified NS5A(ΔAH) of genotype 1b (J4, left) or genotype 2a (JFH-1, right) was incubated with 1 nM radiolabeled 3′ UTR RNA in the presence of increasing concentrations (0 to 500 nM) of unlabeled 3′ UTR of either genotype 1b or 2a or control FMDV 3C aptamer RNA. The percentage of RNA bound to the nitrocellulose membrane was quantified and plotted as a function of the competitor RNA concentration.

