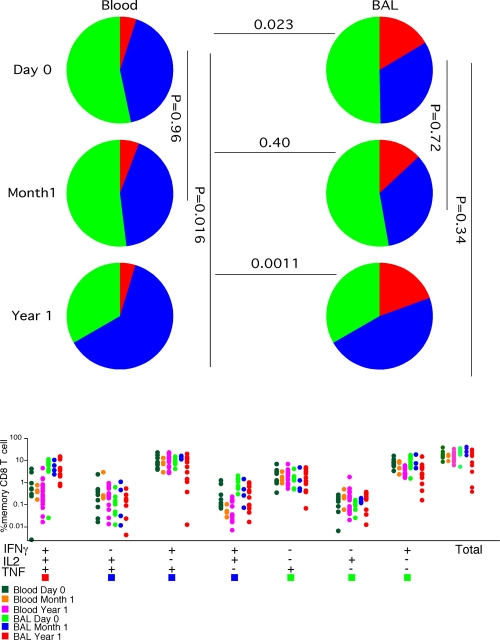
FIG. 5.
Functionality of mitogenically stimulated CD8 T cells in PB and BAL before and after HAART. Shown are the frequency and functionality of mitogenically stimulated CD8 T cells in PB and BAL prior to, after 1 month, and after 1 year of HAART. P values represent the results of Whitney U tests. The frequency of the total producing one, two, or three cytokines and the relative contribution to the total response were determined using SPICE as described in Materials and Methods.

