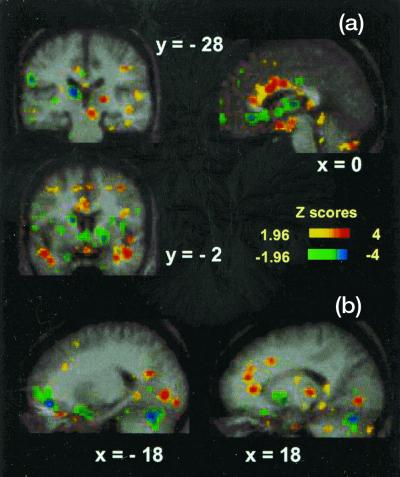
Figure 1.
PET activations and deactivations for the CO2FM vs. CO2MP conditional contrast of displayed on the average MRI brain image of the nine subjects. a shows activations in the anterior cingulate region (x = 0), bilaterally in the middle temporal gyrus (y = −2), and in the right midbrain (y = −28). Deactivations are evident in the left caudate nucleus (y = −2), the medial anterior cingulum (x = 0), and the left pulvinar and left inferior parietal lobule (y = −28). b shows activations in the left lingual gyrus (x = −18) and right anterior cingulate, posterior thalamus, and lingual gyrus (x = 18). Deactivations can be observed in the left medial frontal gyrus, bilaterally in the cerebellum, and in the right lentiform nucleus (x = 18).

