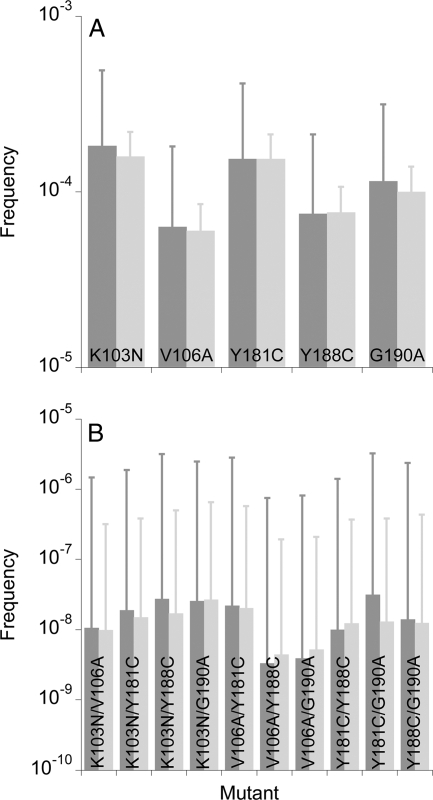
FIG. 8.
The expected frequencies of single (A) and double (B) mutants in proviral DNA predicted by our simulations when the population of cells is 2,000 and each cell is infected with 3 virions (dark gray bars) and when the population of cells is 105 and the frequency of multiple infections of cells follows a distribution in which most cells are singly infected (Materials and Methods) (light gray bars). Error bars are standard deviations. The remaining parameters are the same as in Fig. 3. The corresponding frequencies in cell-free viral RNA are shown in Fig. S5 in the supplemental material.

