FIG. 3.
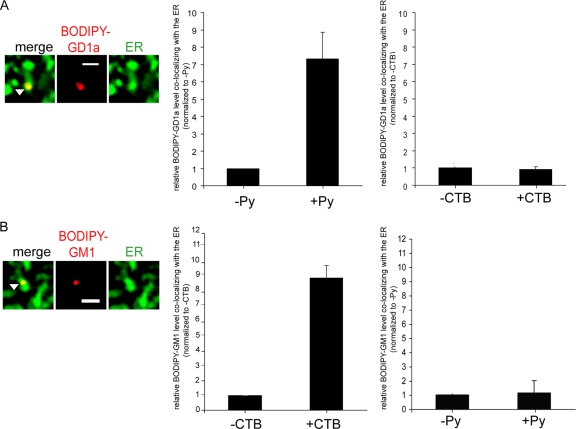
Ligand-induced retrograde transport of gangliosides to the ER. (A) A1-1 cells expressing CFP-HO2 were incubated first with BODIPY-GD1a at 4°C for 15 min and were then either incubated with Py at 37°C for 4.5 h or left untreated or incubated with CTB at 37°C for 1 h or left untreated. The picture shown is a representative image of BODIPY-GD1a colocalizing with the ER. Scale bar, 1 μm. Left graph, quantification of the extent of colocalization between BODIPY-GD1a and the ER from at least 3 control or Py-supplemented cells. Right graph, quantification of the extent of colocalization between BODIPY-GD1a and the ER from at least 3 control or CTB-supplemented cells. Data represent means ± standard deviations. (B) NIH 3T3 cells expressing CFP-HO2 were incubated first with BODIPY-GM1 at 4°C for 15 min and then either incubated with CTB at 37°C for 1 h or left untreated or incubated with Py at 37°C for 4.5 h or left untreated. The picture shown is a representative image of BODIPY-GM1 colocalizing with the ER. Scale bar, 1 μm. Left graph, quantification of the extent of colocalization between BODIPY-GM1 and the ER from at least 3 control or CTB-supplemented cells. Right graph, quantification of the extent of colocalization between BODIPY-GM1 and the ER from at least 3 control or Py-supplemented cells. Data represent means ± standard deviations.

