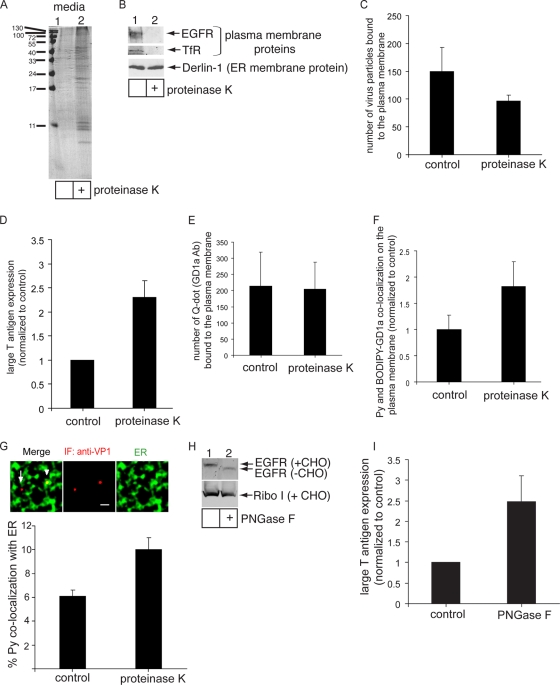
FIG. 5.
Removal of plasma membrane glycoproteins stimulates Py infection and ER transport. (A) NIH 3T3 cells were treated with 4 mg of proteinase K/ml at 4°C for 1 h or left untreated. The contents of media from these cells were precipitated and subjected to SDS-PAGE analysis followed by Coomassie staining. (B) Cells were treated with 4 μg of proteinase K/ml at 4°C for 1 h or left untreated. Cell lysates were subjected to SDS-PAGE followed by immunoblotting with antibodies against the EGFR, TfR, and Derlin-1. (C) Quantification of the number of Py particles bound to the plasma membrane in control and proteinase K-treated cells. At least 3 cells in each group were analyzed. Data represent means ± standard deviations. (D) Large T antigen expression in control and proteinase K-treated cells was analyzed as described for Fig. 1D. Data represent the means ± standard deviations of the results from at least 3 independent experiments. A total of 81 of 5,404 control cells expressed large T antigen. (E) Quantification of the number of quantum dots (Q-dot) (GD1a Ab) bound to the cell surface of control and proteinase K-treated cells. (F) Quantification of Py and BODIPY-GD1a colocalization on the plasma membrane of control and proteinase K-treated A1-1 cells. Data were analyzed as described for Fig. 2. (G) Py-ER colocalization in control and proteinase K-treated cells was analyzed by immunofluorescence (IF) staining. Top panel, representative images. Arrowhead, Py that colocalized with the ER. Arrow, Py that did not colocalize with the ER. Scale bar, 1 μm. Bottom panel, quantification of Py colocalizing with the ER from at least 3 cells. Data represent means ± standard deviations. (H) Cells were treated with or without PNGase F at 37°C for 1 h. Cell lysates were subjected to SDS-PAGE followed by immunoblotting with antibodies against the EGFR and Ribo I. (I) Large T antigen expression in control and PNGase F-treated cells was analyzed as described for Fig. 1D. Data represent the means ± standard deviations of the results from at least 2 independent experiments. A total of 27 of 1,232 control cells expressed large T antigen.

