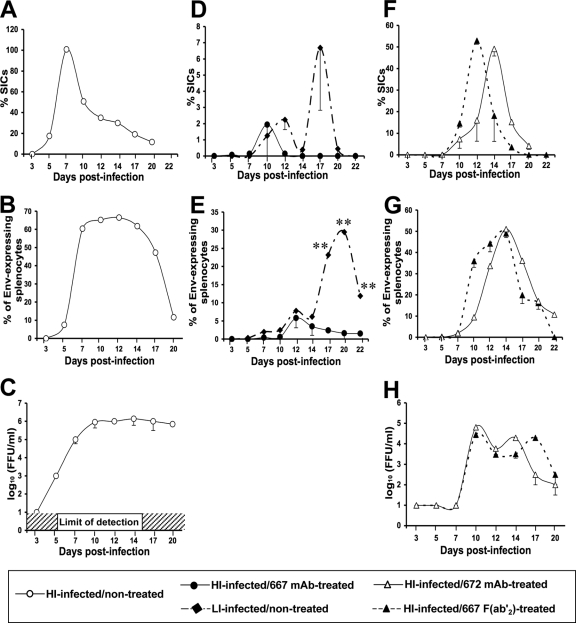
FIG. 2.
Viral propagations in HI-infected/immunotherapy-treated mice versus HI-infected/nontreated animals. A total of 54 newborn mice were used per group of HI-infected/667 MAb-treated and HI-infected/nontreated mice (two animals per time point in three different experiments), and a total of 36 newborn mice were used for each of the other groups (two animals per time point in two different experiments). Viral propagation was monitored using three criteria: spleen infectious centers, Env-expressing splenocytes, and serum viremia. (A, D, and F) SIC assays. Spleen cells from simply infected mice or from infected mice treated with either the 667 MAb, the 667 F(ab′)2 fragment, or the 672 MAb were isolated and plated onto indicator Mus dunni cells. SICs corresponded to the number of infectious centers scored in focal immunofluorescence assays after 3 days of coculture, as described in Materials and Methods. % SICs on the y axis indicates the percentage of infectious splenocytes versus the total number of splenocytes used in the experiment. (B, E, and G) Assay of Env-expressing splenocytes. Splenocytes were purified from the various mice, and Env expression at their surface was quantified by flow cytometry, as described in Materials and Methods. The percentage of Env-expressing splenocytes is indicated on the y axis. (C and H) Serum viremia assay. Viremia was assayed in a focal immunofluorescence assay, as indicated in Materials and Methods. Error bars indicate standard deviations. Statistical significance between the groups was established using the Mann and Whitney test. **, P < 0.01; *, P < 0.05.

