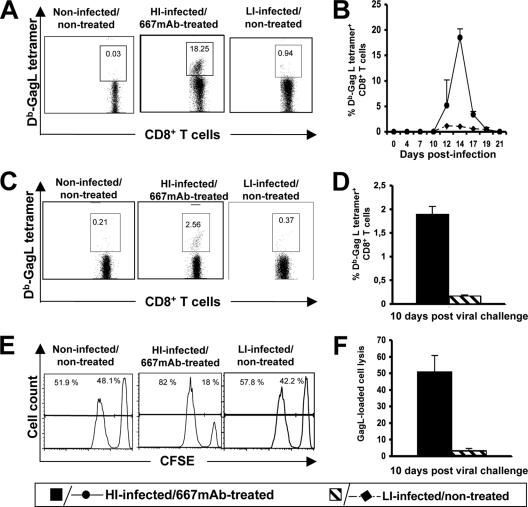
FIG. 4.
CTL response in HI-infected/667 MAb-treated and LI-infected/nontreated mice. Mice were infected as described in Fig. 1 using age-matched noninfected/nontreated mice as controls. (A) Primary CD8+ T-cell response. Typical flow cytometry analyses of Db-GagL+ CD8+ T cells performed on day 14 postinfection are presented. (B) Kinetic analysis of the primary CD8+ T-cell response. The presented data are the averages of values obtained from two mice per time point in each of three independent experiments conducted. (C) Memory CD8+ T-cell response. Typical flow cytometry analysis of Db-GagL+ CD8+ T cells carried out 10 days after a viral challenge performed 8 weeks postinfection. (D) Statistical analysis of the memory CD8+ T-cell response. Eight mice per group were used in three independent experiments conducted as indicated in panel C. (E) Cytotoxic activity against spleen cells loaded with the GagL peptide in mice subjected to a viral challenge. Splenocytes were loaded with GagL or a control peptide and stained in the presence of low and high concentrations of CSFE, respectively. They were administered to mice 10 days after viral challenge in week 8 postinfection. Flow cytometry analyses were carried out on the following day. Typical data are presented in the figure. The left panel indicates the proportion of control- and GagL peptide-loaded splenocytes administered to mice. A reduction in CFSEHigh staining (right peak) in the other two panels is indicative of infected cell lysis. (F) Statistical analysis of cytotoxic activity against spleen cells loaded with the GagL peptide in mice subjected to a viral challenge. Eight mice per group were used in three independent experiments as indicated in panel E. Error bars indicate standard deviations.

