
FIG. 5.
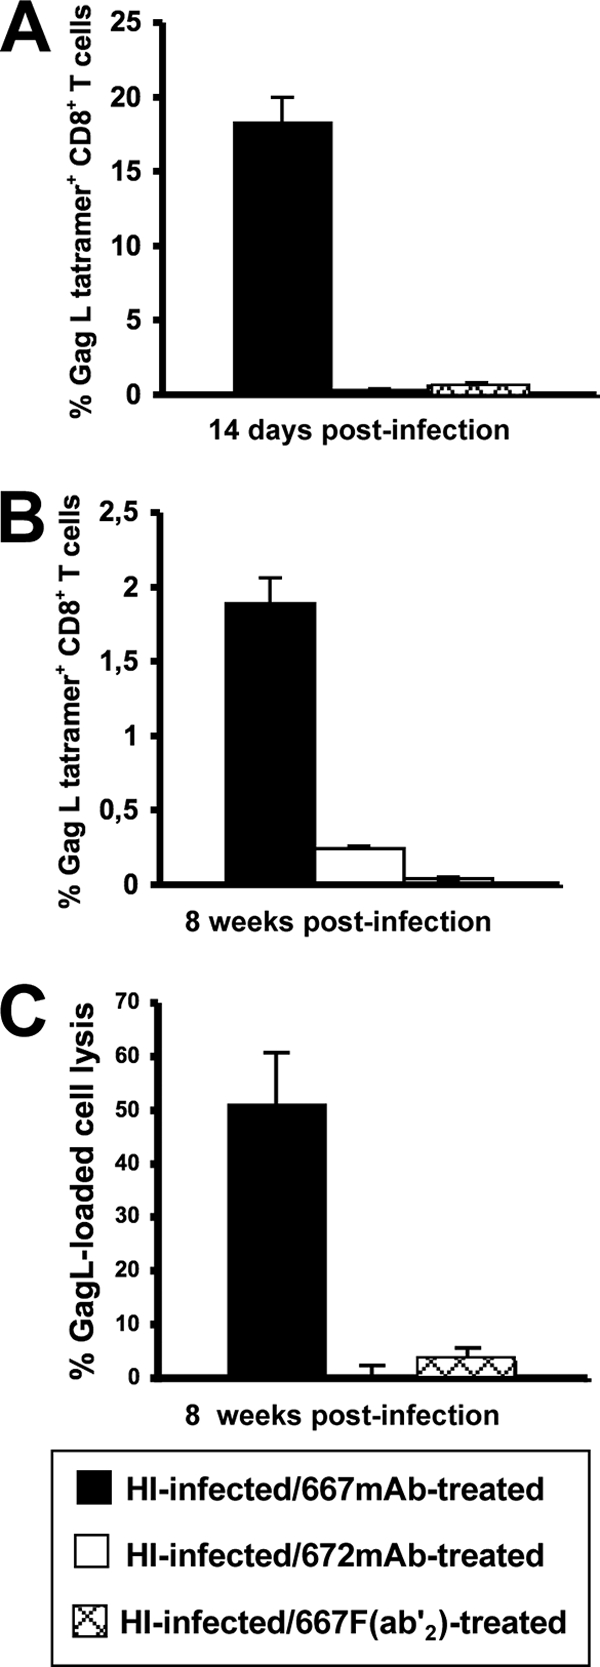
CTL response in HI-infected/667 F(ab′)2-treated and HI-infected/672 MAb-treated mice. Mice were infected as described in the legend to Fig. 1. (A) Primary CD8+ T-cell response. The presented data are the averages of values obtained from two animals analyzed on day 14 postinfection in each of three independent experiments conducted. (B) Memory CD8+ T-cell response. Eight mice per group were used in three independent experiments conducted as indicated in the legend to Fig. 4C. (C) Cytotoxic activity against spleen cells loaded with the GagL peptide in mice subjected to a viral challenge. Experiments were conducted as described for Fig. 4E and F. Eight mice per group were used in three independent experiments as indicated in the legend to Fig. 4E. Error bars indicate standard deviations.