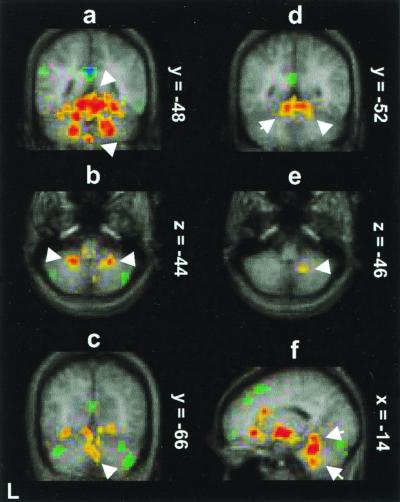
Figure 1.
PET activity (red-yellow) shown on the average MR brain of the nine subjects where breathing the CO2 mixture in a FM (CO2 FM) is compared (a–c) and (f) to breathing a nitrogen/oxygen mixture in a FM (O2 FM) or (d and e) to voluntary PB of room air (hyperventilation). (a) Activation (upper arrow) in quadrangular lobule (V, VI) and pyramis (vermis) (lower arrow) (coronal section y = −48). (b) Activation in bilateral biventer lobule (VIIIB) (transverse section z = −44). (c) Activation in bilateral declive (vermis) (VI) (coronal section y = −66). (d) Bilateral activation in quadrangular lobule (coronal section y = −52). (e) Activation in biventer lobule (transverse section z = −46). (f) Activation in central lobule (upper arrow) and tonsil (lower arrow) (sagittal section x = −14). The color coding of Z scores is shown in Fig. 2.

