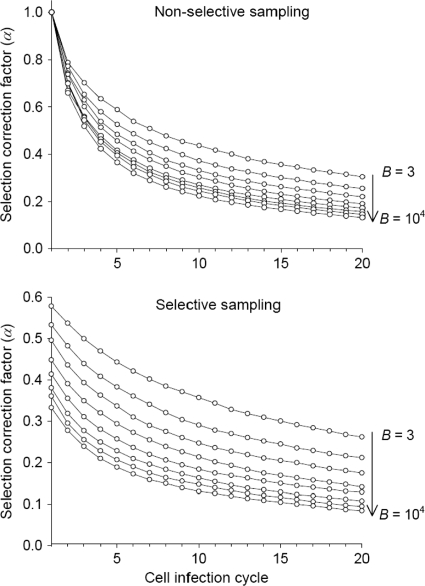
FIG. 1.
Selection-correction factor α as a function of time, measured in cell infection cycles, for different values of the burst size (or viral yield) B. α is mathematically defined in Methods (equation 2 and text). It allows us to quantify the loss in mutation frequency (fs) due to selection and thus to account for selection bias in mutation rate estimates. The expected value of α depends on whether mutation sampling is done in the absence of selection (top), as would be the case for a molecular clone sequencing experiment, or in the presence of selection (bottom), as, for instance, in direct plaque sequencing. The expected α is plotted for eight B values: 3, 10, 30, 100, 300, 103, 3 × 10³, and 104. Fitness effects of random single-nucleotide substitutions (defined in equation 8) were assumed to follow an exponential distribution with mean E(sv) = 0.12 plus a class of lethal mutations occurring with probability pL = 0.3 (equation 7).

