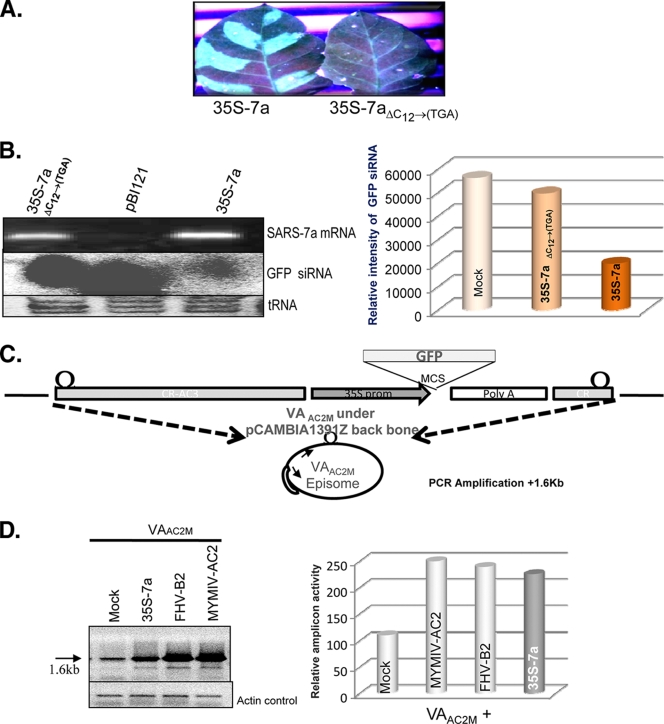
FIG. 2.
The SARS-CoV 7a protein, not the RNA, is responsible for the RNA silencing suppression activity. (A) Visualization under UV light of leaf tissue from GFP-silenced plants agroinfiltrated with 35S 7a and 35-7aΔC12→(TGA) after 8 dpi. (B) The top part of the left panel shows the reverse transcription-PCR (RT-PCR) result for SARS-CoV 7a-specific primers, where 7a mRNA has been generated both in wild-type and 7aΔC12→(TGA)-agroinfiltrated leaves. The middle portion of the panel shows the siRNA level corresponding to the reporter gene GFP upon agroinfiltration with empty vector pBI121, 35S 7a, and 35S 7aΔC12→(TGA). The lower portion shows the tRNA loading control on 15% PAGE gel stained with EtBr. The right panel shows a density graph of the siRNA blot normalized with the tRNA control. (C) Schematic representation of the viral amplicon-based RNA silencing suppressor assay. The VAAC2M vector is shown where the viral amplicon with a reporter GFP gene was cloned into the backbone of the plant binary vector pCAMBIA 1391Z. The VAAC2M vector in planta replication generates an amplicon of 2.4 kb. The bottom panel shows a diagrammatic representation of the PCR strategy used for detection of amplicon levels. (D) PCR-based analysis for determining the enhancement of replication in the presence of AC2, FHV B2, and 35S 7a upon coinfiltration with VAAC2M in the leaves of Nicotiana tabacum cv. Petit Havana at 14 days postinfiltration. The left panel shows an agarose gel stained with EtBr, showing a 1.6-kb band as the PCR product of the viral amplicon, with the respective actin control in the bottom gel. The right panel shows the density graph of the PCR product normalized with the actin control.

