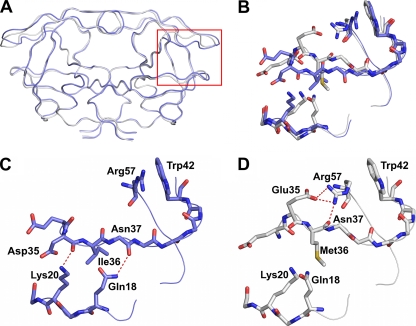
FIG. 2.
(A) Ribbon diagram superposition of DRVAE-WT (blue) and DRVB-WT (gray). The red box indicates the region of the protease molecule highlighted in panels B to D. (B) Structural rearrangement of the flap hinge and core regions between DRVAE-WT (blue) and DRVB-WT (gray). (C) Flap hinge and core regions of DRVAE-WT. (D) Flap hinge and core regions of DRVB-WT protease. Hydrogen bond interactions are indicated by red dashed lines.

