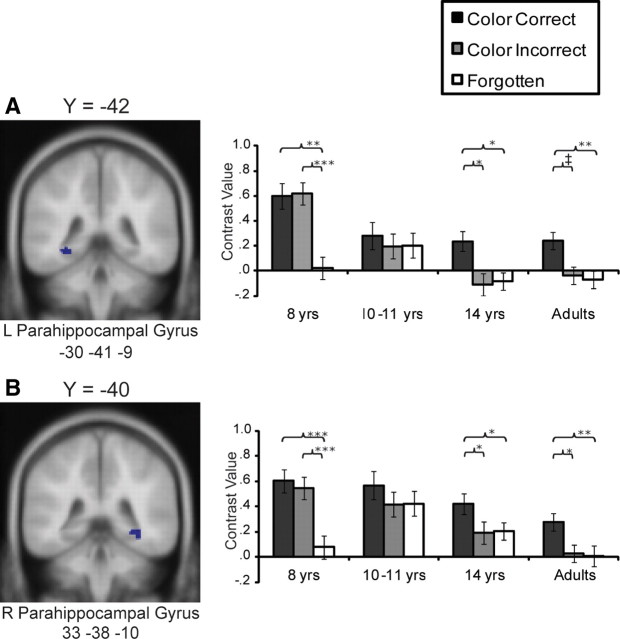
Figure 3.
A, B, Average contrast values for each age group for ROIs in the left (L; A) and right (R; B) posterior parahippocampal gyrus, identified from the contrast Color Correct > Miss from all participants, p < 0.001. Error bars indicate SEs. Significance levels are indicated as follows: ***p < 0.001, **p < 01, *p < 0.05; ‡p = 0.05.

