
FIGURE 7.
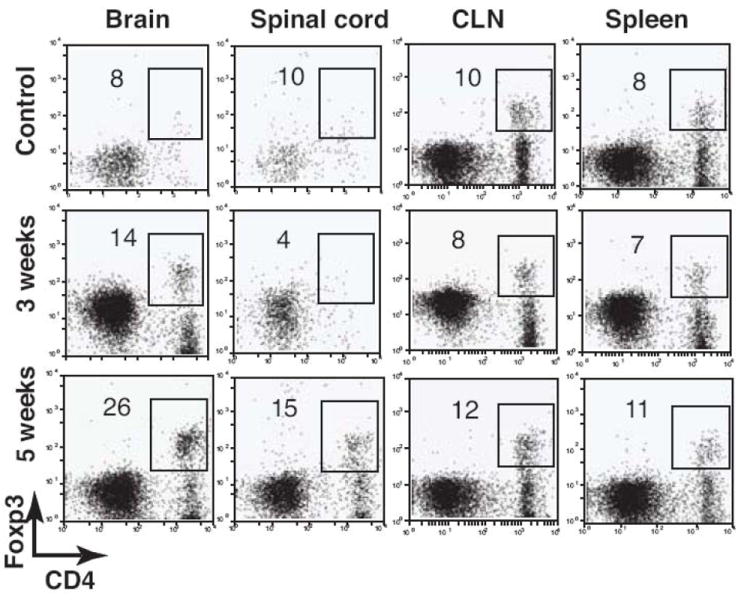
The frequency of Foxp3+CD4+ T cells proportionally increases in the CNS during the course of i.c. BCG infection. C57BL/6 mice were i.c. infected with BCG. Control mice were i.c. injected with PBS. After 3 and 5 weeks mice were perfused, and their organs were removed. Single cell suspensions were prepared from the brain, spinal cord, CLN, and spleen and stained with anti-CD4 and anti-Foxp3 antibodies. Dot plots show Foxp3+CD4+ T cells from a lymphocyte gate from the indicated organs. Numbers represent the frequency of the boxed population among CD4+ T cells. All plots are representative of three to four animals.