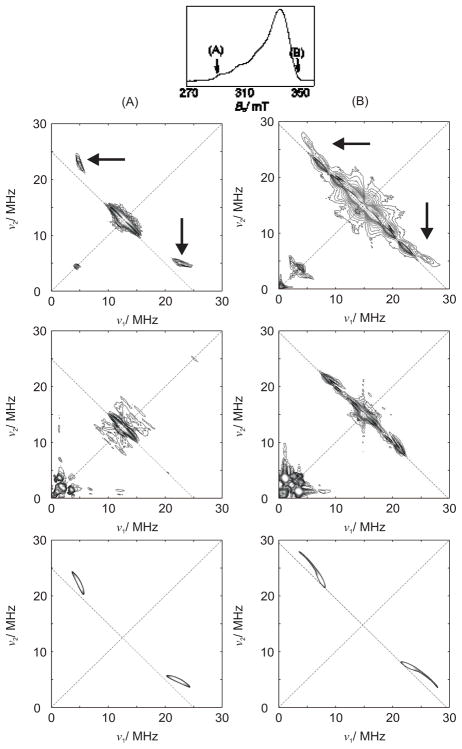
Figure 3.
X-band HYSCORE spectra taken at the observer positions (A) and (B) as indicated in the top figure. First row: 1 formed with H33m. The features that disappear upon mono-deuteration of the ligand are indicated with arrows. Second row: 1 formed with D-H33m. Third row: HYSCORE simulation of the C-Ha interaction of interest.

