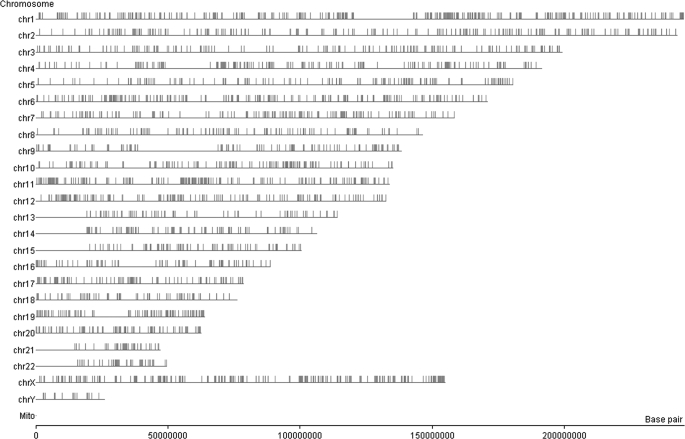
FIGURE 6.
Genome-wide distribution of H3K56 acetylation. Map depicting genome-wide occupancy of H3K56 acetylation. ChIP-on-chip was performed using anti-H3K56ac antibody as described under “Experimental Procedures,” and analysis of enriched genomic regions was carried out using Genespring GX10 software (Agilent Technologies). Each vertical line on the chromosomal map represents the location of an enriched probe. Certain regions on various chromosomes show clustering of H3K56ac occupancy.

