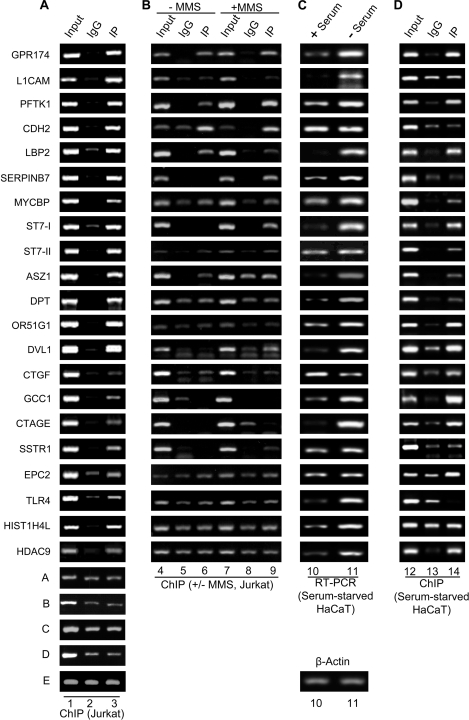
FIGURE 7.
H3K56ac is enriched in upstream regulatory regions of multiple genes involved in the cellular pathways implicated in DNA damage response and tumorigenesis in Jurkat cells and G1 arrested HaCaT cells. A, ChIP analysis was performed in Jurkat cells treated with 10 mm sodium butyrate for 24 h using anti-H3K56ac antibody, as described under “Experimental Procedures.” The gel pictures in individual panels depict PCR-amplified products using primers specific for the indicated genes and the DNA eluted from chromatin, immunoprecipitated using anti-H3K56ac (lane 3) and control rabbit IgG (lane 2). Lane 1, input chromatin. The last five panels (rows A–E) depict the controls from genomic loci that show no specific enrichment in the immunoprecipitated chromatin over the control IgG. B, ChIP analysis was performed in control (− MMS, lanes 4–6) Jurkat cells and Jurkat cells treated with 0.02% MMS for 2 h (+ MMS, lanes 7–9) as described under “Experimental Procedures.” The gel pictures in individual panels depict the PCR-amplified products using primers specific for the indicated genes and the DNA eluted from chromatin, immunoprecipitated using anti-H3K56ac (lanes 6 and 9) and control rabbit IgG (lanes 5 and 8). Lanes 4 and 7 depict input chromatin. C, real time quantitative RT-PCR was performed for monitoring the expression levels of the corresponding genes from A and B using cDNA obtained from control (+ serum, lane 10) and G1-arrested, serum-starved (− Serum, lane 11) HaCaT cells. The CT values for various genes were normalized with that of β-actin (bottom panel). D, ChIP was performed using anti-H3K56ac antibody in serum-starved HaCaT cells treated with 10 mm sodium butyrate for 24 h. The gel pictures in the individual panels depict PCR-amplified products using primers specific for the indicated genes and the DNA eluted from chromatin, immunoprecipitated using anti-H3K56ac (lane 14) and control rabbit IgG (lane 13). Lane 12, input chromatin. Quantitative ChIP-PCRs were performed, and the fold enrichment over IgG was calculated as described under “Experimental Procedures.” The quantification of all of the above PCRs is tabulated in supplemental Table S2.

