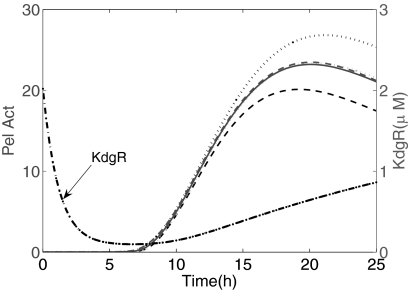
FIGURE 8.
Study of the sensitivity of Pel production dynamics for a 20% variability around parameters of Table 1. The continuous line represents the best fit with no variation on parameters. The dashed line and the dotted line represent, respectively, the lower and the upper boundary for the set of parameters pmin and pmax obtained with 10% variation of parameters of Table 1 but with no variation of the parameters of Table 2. However, these fits can be optimized again to curves close to the best fit by a 50% variation on Kd6, 10% variation on k5 and γ, and no variation on β1 and ϵ. The KdgR dynamics is shown as a dashed-and-dotted line, using the parameters of Table 1. The temporary decrease of KdgR is due to the cytoplasmic dilution entailed by cell divisions during the exponential phase.

