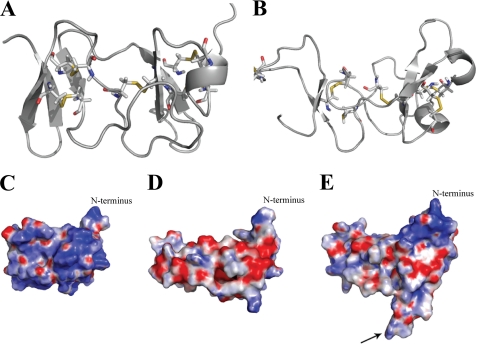
FIGURE 6.
Homology modeling of crayfish P. leniusculus astakine 1 and surface charge prediction of astakine 1 and astakine 2, compared with the template of black mamba intestinal toxin (MIT1). A, model of MIT1 (Protein Data Bank entry 1IMT) showing the predicted five cysteine bridges. B, homology model of astakine 1, predicted cysteine bridges, and free cysteines are shown. C, surface charge calculation of 1IMT. The N terminus is indicated. D, surface charge prediction of P. leniusculus astakine 1. The N terminus is indicated. E, surface charge prediction of P. leniusculus astakine 2. The N terminus is indicated, and the conserved tyrosine-proline residues in the astakine 2 loop are indicated by an arrow.

