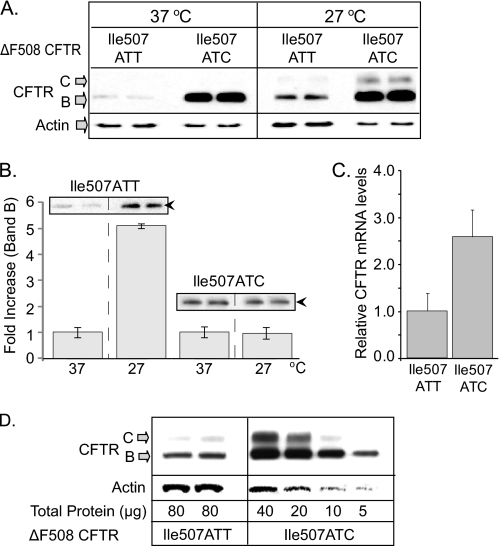
FIGURE 4.
Expression of native (Ile507ATT) and variant (Ile507ATC) ΔF508 CFTR in 293F cells. A, CFTR expression levels at 37 and 27 °C. 293F cells expressing native or variant ΔF508 CFTR were induced with 4 ng/ml doxacyclin and cultured at 37 or 27 °C for 4 h. Cells were lysed in RIPA, and proteins were separated by PAGE (6%). CFTR was detected with MM13–4 monoclonal antibody and ECL. Higher expression of Band B CFTR in the Ile507ATC ΔF508 CFTR-expressing cells at 37 °C and significant levels of Band C CFTR following a 4-h culture at 27 °C are shown. B, native (Ile507ATT) ΔF508 CFTR Band B levels increase at 27 °C. Changes in Band B levels of native (Ile507ATT) and variant (Ile507ATC) ΔF508 CFTR were measured following a 4 h culture at 27 °C by Western blotting and densitometry. Results are expressed as fold increase in Band B density at 27 °C compared with 37 °C controls; n = 3. Inlay, representative gels; black arrowheads: Band B CFTR. C, CFTR mRNA levels following doxacyclin induction and 4 h at 27 °C. Ile507ATT and Ile507ATC ΔF508 CFTR mRNA levels were compared in real time RT-PCR. mRNA levels in the variant (Ile507ATC) cells are plotted as fold increase over native (Ile507ATT) ΔF508 CFTR, (n = 6). D, CFTR protein levels in serial dilutions of variant, Ile507ATC ΔF508 CFTR expressing cell lysates. Cellular proteins were isolated following doxacyclin induction and 4-h culture at 27 °C. Western blots were performed as described in A. Enhanced Band B and significant Band C formation in the Ile507ATC samples compared with native (Ile507ATT) ΔF508 CFTR.

