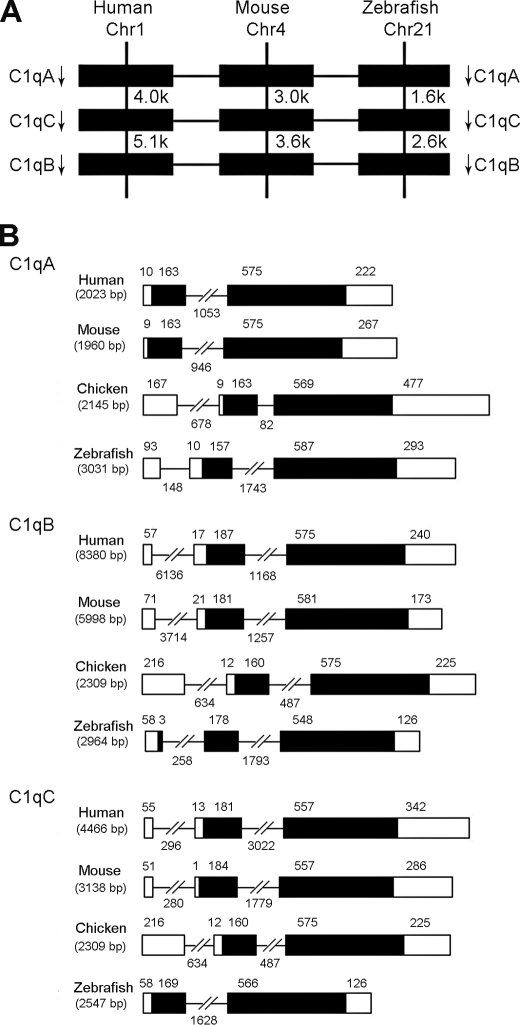
FIGURE 2.
A, comparison of gene locations of c1qA, c1qB, and c1qC among human, mouse, and zebrafish. Arrows indicate gene orientation. Numbers below gene names indicate gene positions. B, comparison of genomic organizations of c1qA, c1qB, and c1qC genes among human, mouse, chicken, and zebrafish. Rectangles represent the exons, whereas the lines between them indicate the introns. Exons are indicated by black boxes, and untranslated regions are indicated by white boxes. The sizes of exons and introns are indicated above them.

