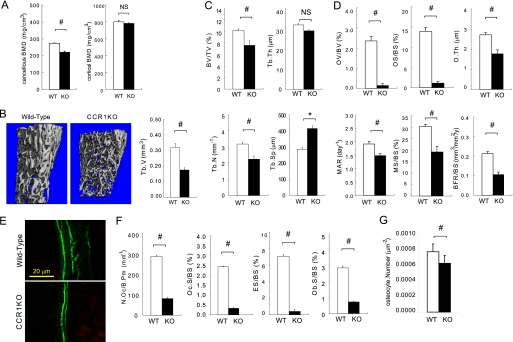
FIGURE 1.
Bone morphometric analyses of CCR1−/− mice. A shows the bone mineral density of trabecular and cortical bones in distal femurs as measured by peripheral quantitative CT. B shows the microCT images and the quantitative measurements of trabecular bones (Tb.V.) in the distal femurs of wild-type and Ccr1−/− mice (n = 10). In C–F, the bone histomorphometric analyses of distal femurs in wild-type and CCR1−/− mice were carried out as described under “Experimental Procedures.” Parameters relating to the trabecular structure (in C): bone volume per tissue volume (BV/TV), trabecular number (Tb.N.), and trabecular separation (Tb.Sp.). Parameters relating to bone formation (in D): osteoid volume to bone volume (OV/BV), osteoid surface/bone surface (OS/BS), osteoid thickness (O.Th.), formation rate referenced to bone surface (BFR/BS), mineral apposition rate (MAR), and mineralizing surface per bone surface (MS/BS). The immunofluorescence images of calcein labeling in wild-type and Ccr1−/− mice (in E). Parameters relating to bone resorption (in F): osteoclast number per bone perimeter (N.Oc./B.Pm), osteoclast surface per bone surface (Oc.S./BS), eroded surface per bone surface (ES/BS), and osteoblast surface per bone surface (Ob.S./BS). The bone histomorphometric analysis data are represented as the mean ± S.E. obtained from six mice in each group. #, significantly different from wild-type controls, p < 0.05. In G, osteocyte numbers per area are represented as the mean ± S.E. obtained from three mice in each group.

