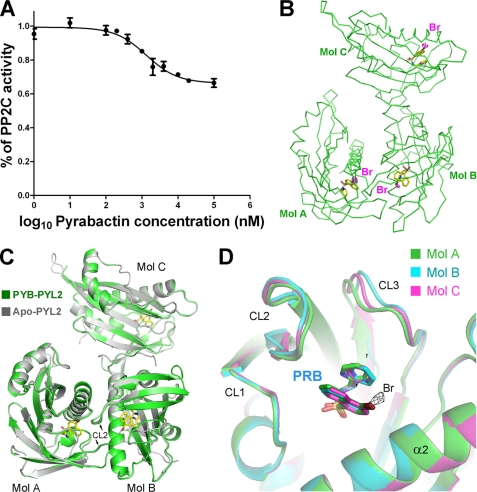
FIGURE 1.
Structure of pyrabactin-bound PYL2. A, PYL2 inhibits ABI1 in response to pyrabactin. The concentration of ABI1 was 0.4 μm for all of the assays throughout the paper. The details of the experiments are described under “Experimental Procedures.” B, there are three pyrabactin-bound PYL2 molecules in each asymmetric unit in the crystal structure. The positions of the pyrabactin molecules are confirmed by the anomalous signal of bromide, which, shown as a magenta dash, is contoured at 3σ. C, overall structure of pyrabactin-bound PYL2 is identical to that of apo-PYL2, with an open conformation despite pyrabactin binding. The structure of three pyrabactin-bound PYL2 molecules (named Mol A, Mol B, and Mol C, respectively) from each asymmetric unit is superimposed on that of apo-PYL2. Pyrabactin molecules are shown as yellow sticks. D, Mol A (green), Mol B (cyan), and Mol C (magenta) from each asymmetric unit of PYL2 are superimposed. The anomalous signal of bromide (black mesh) in Mol A is contoured at 3σ. All structure figures were prepared with PyMOL (19).

