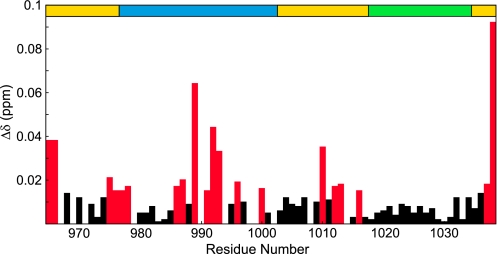
FIGURE 2.
Chemical shift map of CP binding on CAH3a/b. Shown are the chemical shift change magnitudes of residues in CAH3a/b, plotted versus residue number. Significant values (Δδ > 0.015 ppm) are highlighted red. The domain organization of CAH3a/b is shown at the top (gold), with the CAH3a subdomain (blue) and the CAH3b subdomain (green) highlighted.

