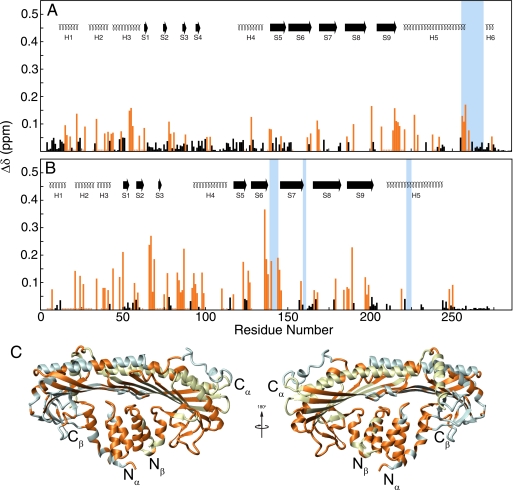
FIGURE 3.
Chemical shift map of CAH3a/b binding on CP. Shown are the chemical shift change magnitudes of residues in CPα (A) and CPβ (B), plotted versus residue number. Significant values (Δδ > 0.10 ppm) are highlighted orange. The secondary structures for each subunit are shown at the top.7 Residues experiencing chemical shift changes are highlighted on the crystal structure of CP (C), including residues qualitatively assigned as being affected by CAH3a/b binding.

