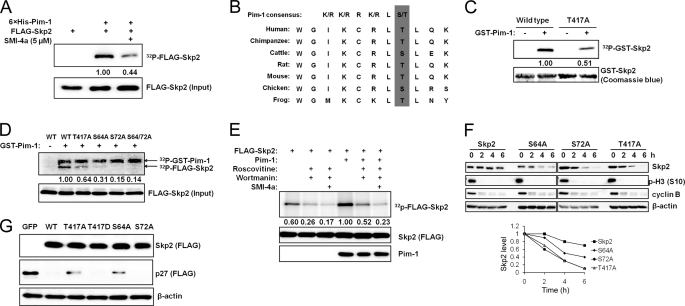
FIGURE 3.
Pim-1 phosphorylates Skp2. A, FLAG-Skp2 was immunoprecipitated from HEK293T cells, incubated with recombinant His-tagged Pim-1 for 30 min with or without SMI-4a for an in vitro kinase assay (“Experimental Procedures”) followed by SDS-PAGE autoradiography (upper panel) and immunoblot analyses (lower panel). The phosphorylation of FLAG-Skp2 was quantified by densitometry from three independent experiments after normalization to input. B, C-terminal sequence of Skp2 contains a Pim-1 consensus site. C, GST-tagged Skp2 proteins or a T417A mutant was incubated with recombinant GST-Pim-1 and [γ-32P]ATP for 30 min, and subjected to SDS-PAGE followed by autoradiography. The phosphorylation of GST-Skp2 was quantified by densitometry from three independent experiments with normalization to Coomassie Blue staining. D, wild type (WT) FLAG-Skp2 and its mutants T417A, S64A, S72A, and S64A/S72A were immunoprecipitated from HEK293T cells, incubated with recombinant GST-tagged Pim-1 and [γ-32P]ATP for 30 min, followed by SDS-PAGE autoradiography (upper panel) and immunoblot analysis (lower panel). The phosphorylation of FLAG-Skp2 was quantified by densitometry from three independent experiments following normalization to the level of protein input. E, HeLa cells were pretreated with roscovitine (20 μm), wortmannin (1 μm), or SMI-4a (10 μm) for 1 h, transfected with human Pim-1 and Skp2, and labeled with 32Pi followed by FLAG immunoprecipitation, autoradiography (upper panel), and FLAG/Pim-1 immunoblots (two lower panels). The phosphorylation of FLAG-Skp2 was quantified by densitometry from three independent experiments along with normalization to Skp2 expression. F, HeLa cells were transfected with the indicated Skp2 constructs and synchronized in M phase by mitotic shake-off of cells obtained after release from a thymidine-nocodazole block. The cells were then replated and allowed to progress through the cell cycle in the presence of cycloheximide (100 μg/ml). Immunoblot analysis was performed at specific time points using antibodies to cyclin B and phosphohistone H3 Ser10 (p-H3 (S10)) as controls. Densitometric analysis was performed using ImageJ software to quantify the expression of Skp2. Skp2 band intensity was normalized to β-actin and then normalized to the t = 0 controls. G, HEK293T cells were transfected with a FLAG-tagged p27 Skp2 construct or a GFP control. Expression of exogenous p27 and Skp2 is measured by immunoblotting.

