
FIGURE 1.
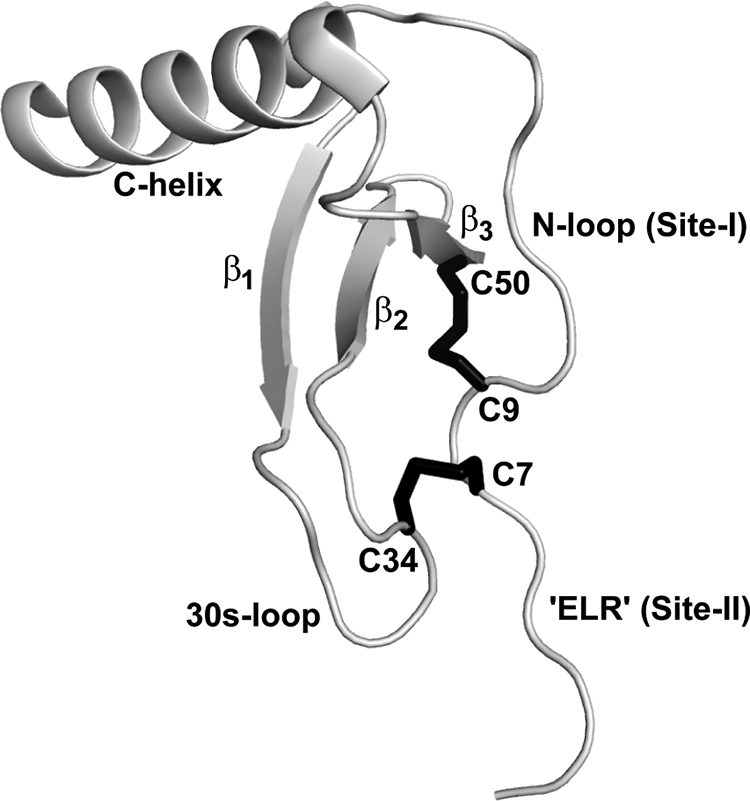
Molecular plot of CXCL8 monomer. The CXC motif and the secondary structural regions are highlighted. Disulfide bonds are shown in black. Molecular plot was generated using Pymol (34).
Official websites use .gov
A
.gov website belongs to an official
government organization in the United States.
Secure .gov websites use HTTPS
A lock (
) or https:// means you've safely
connected to the .gov website. Share sensitive
information only on official, secure websites.
Molecular plot of CXCL8 monomer. The CXC motif and the secondary structural regions are highlighted. Disulfide bonds are shown in black. Molecular plot was generated using Pymol (34).