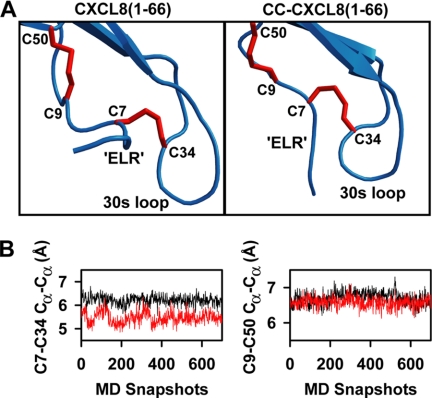
FIGURE 6.
MD simulations of CC-CXCL8. Panel A, average structures of the most populated clusters of CC-CXCL8(1–66) and CXCL8(1–66) over a 13 ns MD simulation. Structures are juxtaposed and not superimposed for clarity. Note the difference in the relative orientation of N terminus with respect to the 30s loop and the rearrangement in the Cys7-Cys34 disulfide bridge conformation. Panel B, plots of Cys7-Cys34 and Cys9-Cys50 Cα-Cα distances of 700 structures from the above clusters of CXCL8(1–66) (black) and CC-CXCL8(1–66) (red).

