FIGURE 2.
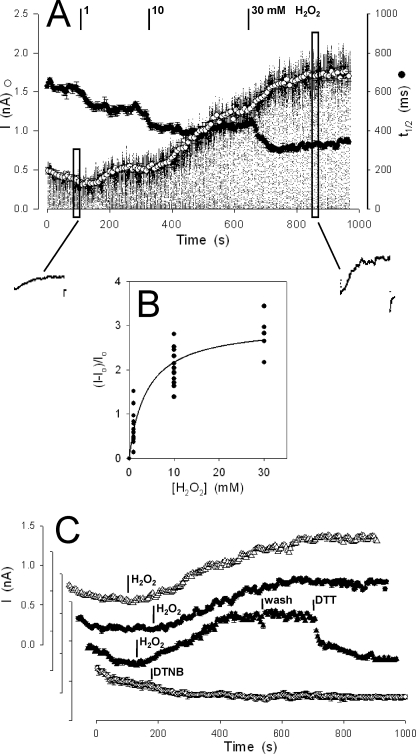
SKOR current is reversibly enhanced by H2O2. A, SKOR current recorded in one HEK293 cell during treatment with 1, 10, and 30 mm H2O2 and voltage clamped in repeated 5-s cycles of −50 mV holding (0.8 s), −80 mV conditioning (200 ms), +80 mV test (3 s), and −50 mV tailing (1 s) voltages. Mean ± S.E. are also shown for current amplitudes (○) calculated from the final 0.1 s of each test voltage step and for activation half-times (t½, ●) determined after normalizing current relaxations. Insets (below), expanded current traces from individual clamp cycles taken just before addition of H2O2 and near the end of the experiment (indicated by the boxed areas of the main trace). B, mean increase in SKOR current amplitudes from all 23 experiments (cells) as a function of H2O2 concentration. Fitting to a simple hyperbolic function yielded an apparent Kd of 3.8 ± 0.6 and maximum 3.0 ± 0.2-fold enhancement. C, representative mean SKOR current enhancement in 10 mm H2O2 without (Δ) and with 10 mm glutathione in the patch pipette (●). Subsequent superfusion with buffer alone (wash) had no effect on the enhanced current, but the enhancement could be reversed by adding 10 mm DTT in the bath (▴). No SKOR current enhancement was seen after adding 10 mm DTNB (○) or buffer alone (not shown).

