FIGURE 7.
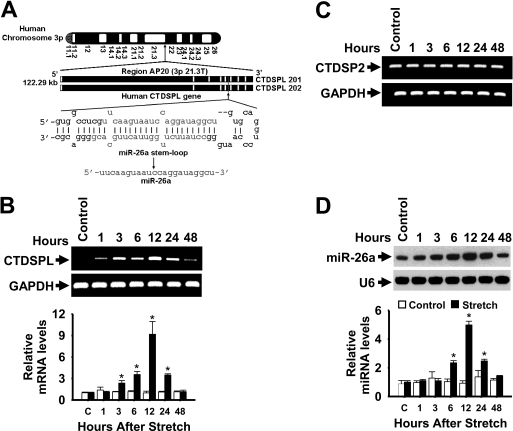
Kinetics of stretch induction of CTDSPL mRNA and mature miR-26a. A, depiction of the genomic structure of the human CTDSPL coding RNA genes in chromosome 3p and location of miR-26a in introns 5 (CTDSPL 201) and 4 (CTDSPL 202). B and D, HASMCs were stimulated with a 1-h stretch, and total RNA was isolated over a 48-h period. The levels of CTDSPL (B) and CTDSP2 (C) mRNAs were analyzed by RT-qPCR (data for CTDSPL mRNA levels by qPCR are not shown) and resolved in 2% agarose gel electrophoresis. Primers were designed to target CTDSPL (identical for CTDSPL 201 and 202) and CTDSP2 sequences extending outside of miR-26a. GAPDH served as both loading control and normalizer. The levels of CTDSPL were presented relatively to that of GAPDH level. *, p < 0.05 versus corresponding control without stretch for the indicated time points. RNA used in the above experiments was also analyzed by solution hybridization technique with 5′-biotin-labeled miR-26a and small nuclear RNA U6 and in a separate experiment by RT-qPCR to assay expression of miR-26a and U6 under the same conditions (D). U6 served as both loading control and normalizer. *, p < 0.05 versus corresponding control without stretch for the indicated time points. Gel pictures are representative of three separate experiments. Each bar indicates mean ± S.E. (n = 3).

