FIGURE 5.
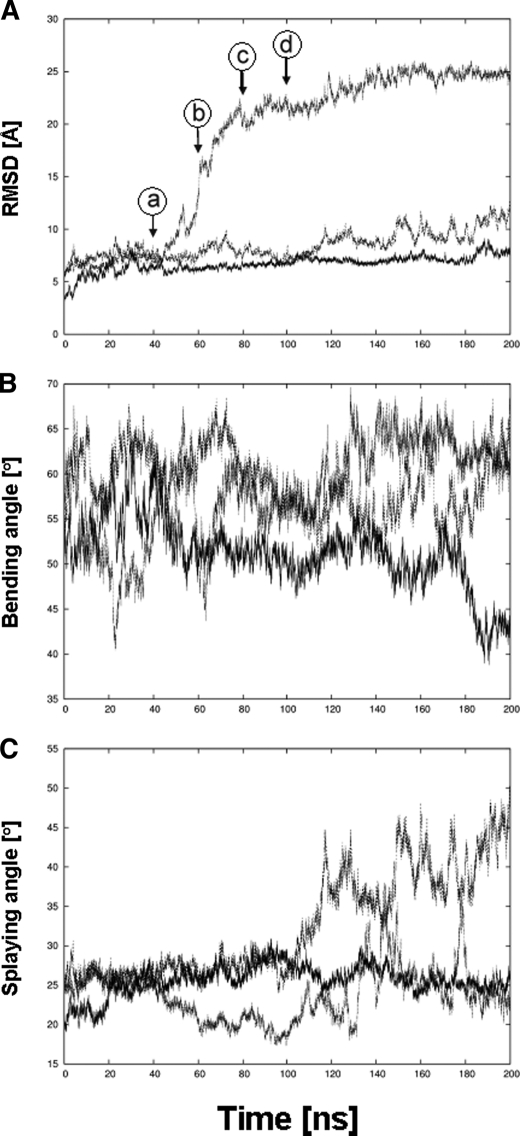
Unbending of the α5β1 integrin ectodomain when simulated in urea and thiourea solution. Time series of geometric parameters of the α5β1 integrin ectodomain simulated for 200 ns in water (straight line), urea solution (dashed line), and thiourea solution (dotted line) are shown. A, root mean square deviation (RMSD) of Cα atoms of α5β1 integrin with respect to the respective starting structure. Arrows indicate when conformations depicted in A–D of Fig. 7 were extracted from the trajectory of α5β1 integrin in thiourea solution. B, bending angle whose vertex is defined by the center of geometry (COG) of the plexin-semaphorin-integrin domain and whose endpoints are, on the one hand, the COG of the propeller and βA domains and, on the other hand, the COG of the calf-2 and β-tail domains. C, splaying angle whose vertex is defined by the Cα atom of G554 in the thigh domain and whose endpoints are, on the one hand, the COG of the calf-2 domain and, on the other hand, the COG of the β-tail domain. A schematic depiction of both angles is given in Fig. 7, B and C.

