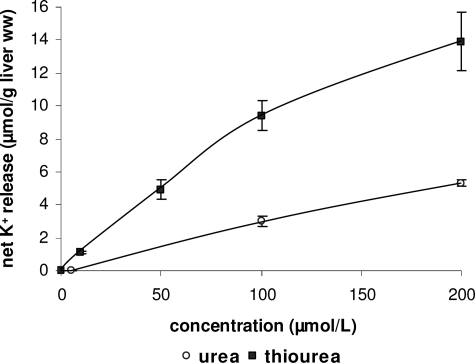
FIGURE 9.
Urea- and thiourea-induced K+ fluxes in perfused rat liver. Rat livers were perfused with either urea (○) or thiourea (■) at the different concentrations and net K+ release in response to (thio)urea was determined by continuously monitoring effluent K+ concentration with a K+-sensitive electrode and planimetry of areas under curves as described under “Experimental Procedures.” Data are given as means ± S.E. of the mean and represent n = 3–7 independent perfusion experiments for each condition.

