FIGURE 1.
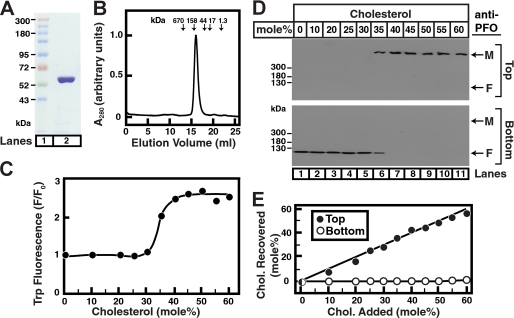
Interaction of purified His6-PFO(C459A) with liposomes containing cholesterol. A, Coomassie staining. Recombinant His6-PFO(C459A) was purified in two steps as described under “Experimental Procedures.” An aliquot (5 μg) was subjected to 8% SDS-PAGE, and proteins were visualized with Coomassie Brilliant Blue R-250 stain (lane 2). The molecular masses of protein standards are indicated (lane 1). B, gel filtration chromatography. Buffer A (0.5 ml) containing 100 μg of His6-PFO(C459A) was loaded onto a Superose 6 column and chromatographed at a flow rate of 0.5 ml/min. Absorbance at 280 nm was monitored continuously to identify the purified protein. Standard molecular mass markers (thyroglobulin, 670 kDa; γ-globulin, 158 kDa; ovalbumin, 44 kDa; myoglobin, 17 kDa; and vitamin B12, 1.35 kDa) were chromatographed on the same column (arrows) under the same conditions. The apparent molecular mass of His6-PFO(C459A) is ∼140 kDa. C, tryptophan fluorescence. Each reaction mixture contained 4 μm PFO and 800 μm liposomes composed of DOPC and the indicated amounts of cholesterol. After incubation for 1 h at 37 °C, tryptophan fluorescence from the samples was measured (excitation wavelength, 290 nm; emission wavelength, 340 nm). F0 is defined as the fluorescence from mixtures of His6-PFO(C459A) and liposomes containing 0% cholesterol. Each value is the average of triplicate assays. D, density gradient analysis. An aliquot (50% of total) of the reaction mixtures from C was loaded on the bottom of a discontinuous sucrose gradient as described under “Experimental Procedures.” After centrifugation at 100,000 × g for 1 h, the gradient was drained from the bottom into two fractions. Immunoblot analysis of His6-PFO(C459A) in low density (Top) and high density (Bottom) sucrose gradient fractions was carried out as described under “Experimental Procedures.” M, membrane-bound oligomeric form of PFO; F, free form of PFO. E, lipid analysis. Lipids were extracted from top and bottom fractions from each gradient in D, and the amounts of cholesterol and phospholipids were quantified as described under “Experimental Procedures.”

