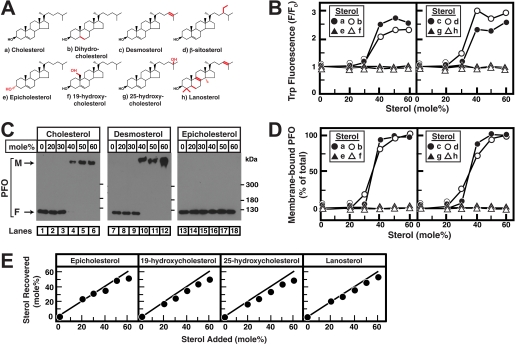
FIGURE 3.
Sterol specificity of His6-PFO(C459A). A, chemical structures of sterols. Differences from cholesterol are highlighted in red. B, tryptophan fluorescence. Each reaction mixture contained 4 μm His6-PFO(C459A) and 800 μm liposomes composed of DOPC and various amounts of the indicated sterols. After incubation for 1 h at 37 °C, tryptophan fluorescence from the samples was measured (excitation wavelength, 290 nm; emission wavelength, 340 nm). F0 is defined as the fluorescence from mixtures of His6-PFO(C459A) and liposomes containing 0% sterol. Each value is the average of triplicate assays. C, immunoblot analysis. An aliquot (0.5% of total) of the reaction mixtures from B, corresponding to the indicated sterol, was subjected to 4% SDS-PAGE, and immunoblot analysis for PFO was carried out as described under “Experimental Procedures.” M, membrane-bound oligomeric form of PFO; F, free form of PFO. D, densitometric quantification of PFO immunoblots. The percentage of membrane-bound oligomeric form of PFO relative to the total (membrane-bound plus free) is shown. Quantification results are shown for all eight sterols in A, including cholesterol, desmosterol, epicholesterol (immunoblots shown in C), and dihydrocholesterol, β-sitosterol, 19-hydroxycholesterol, 25-hydroxycholesterol, and lanosterol (immunoblots not shown). E, lipid analysis. An aliquot (50% of total) of the reaction mixtures from B, corresponding to the indicated sterol, was loaded on the bottom of a discontinuous sucrose gradient as described under “Experimental Procedures.” After centrifugation at 100,000 × g for 1 h, the gradient was drained from the bottom into two fractions. Lipids were extracted from the low density, liposome-containing fractions from each gradient (see Fig. 1), and the amounts of sterols and phospholipids were quantified as described under “Experimental Procedures.”

