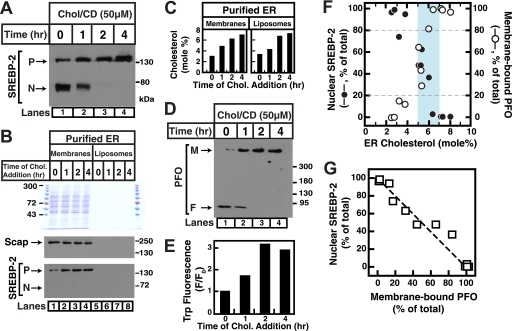
FIGURE 5.
Correlation between SREBP-2 activation in CHO-K1 cells and binding of His6-PFO(C459A) to liposomes made from purified ER membrane lipids. A, on day 0, CHO-K1 cells were set up as described under “Experimental Procedures” in Medium B (10% FBS). On day 3, the cells were washed with PBS and treated with Medium C (lipoprotein-deficient serum) containing 1% HPCD for 1 h and then switched to Medium C containing 50 μm cholesterol (Chol) complexed to MCD. At the indicated times, the cells were harvested (∼4 × 10⁸/condition from forty 10-cm dishes) and disrupted by a ball-bearing homogenizer. A portion of the homogenate (∼5% of total) was saved for immunoblot analysis of SREBP-2 (60 μg/lane) (P = precursor form of SREBP-2; N = cleaved nuclear form of SREBP-2). B and C, the remainder (95%) of the homogenized cells was used to purify ER membranes, an aliquot of which (20% of total) was saved for protein and lipid characterization. ER liposomes were prepared using extracted lipids from the remainder of purified ER membranes. Protein, cholesterol, and phospholipid levels were measured as described under “Experimental Procedures.” Purified ER membranes (10 μg of protein/lane; 3 μg of phospholipid/lane) and ER liposomes (0 μg of protein/lane; 10 μg of phospholipid/lane) corresponding to the indicated cholesterol treatment were subjected to 8% SDS-PAGE and analyzed by Coomassie staining (B, top panel) or immunoblot against Scap (B, middle panel) or immunoblot against SREBP-2 (B, bottom panel). The mole fraction of cholesterol in membranes corresponding to each lane is shown in C. D and E, interaction of His6-PFO(C459A) with ER liposomes. Reaction mixtures (200 μl total of buffer A) containing 5 μg of purified His6-PFO(C459A) and ER liposomes (80 μg of phospholipid) prepared from cells subjected to the indicated treatment were incubated for 1 h at 37 °C. An aliquot (0.5% of total) of each reaction mixture was subjected to 4% SDS-PAGE, and immunoblot analysis for His6-PFO(C459A) was carried out as described under “Experimental Procedures” (D). M, membrane-bound oligomeric form of PFO; F, free form of PFO. Tryptophan fluorescence was measured from the remainder of the reaction mixtures (E) (excitation wavelength, 290 nm; emission wavelength, 340 nm). F0 is defined as the fluorescence from mixtures of His6-PFO(C459A) and ER liposomes prepared from cells harvested at the 0-h time point. F, densitometric quantification of A and D and immunoblots from two other similar experiments showing the percentages of SREBP-2 in the activated, nuclear form relative to the total (nuclear plus precursor) (●) and the percentages of PFO in membrane-bound oligomeric form relative to the total (membrane-bound plus free) (○) as a function of ER cholesterol concentration. The blue shaded region indicates a narrow concentration range where a switch-like response occurs (5–7 mol %). G, correlation plot of the data in F showing the relationship between SREBP-2 activation in response to ER cholesterol modulation and binding of PFO to ER liposomes. The dashed line represents perfect correlation (best fit to data: R2 = 0.94).

