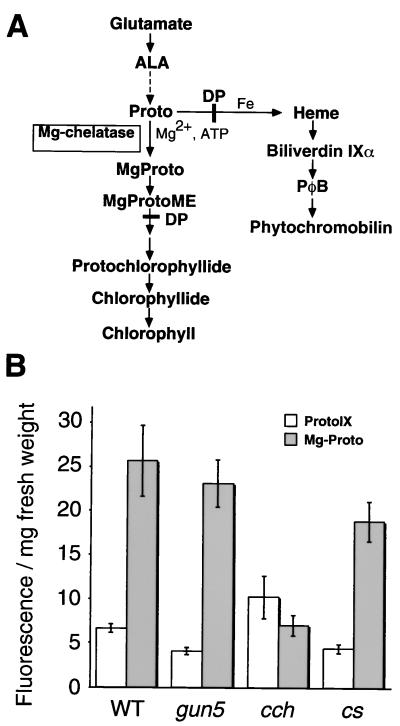
Figure 4.
Proto and MgProto levels in ALA–DP-fed plants. (A) Schematic diagram of chlorophyll biosynthetic pathway. Dashed arrows represent multiple steps, and the steps that are inhibited by DP are indicated by solid lines across the arrows. (B) Proto and MgProto accumulation in seedlings fed with ALA–DP. Etiolated seedlings (4 days old) were fed with ALA and DP, and porphyrin levels were measured as described in Materials and Methods.

