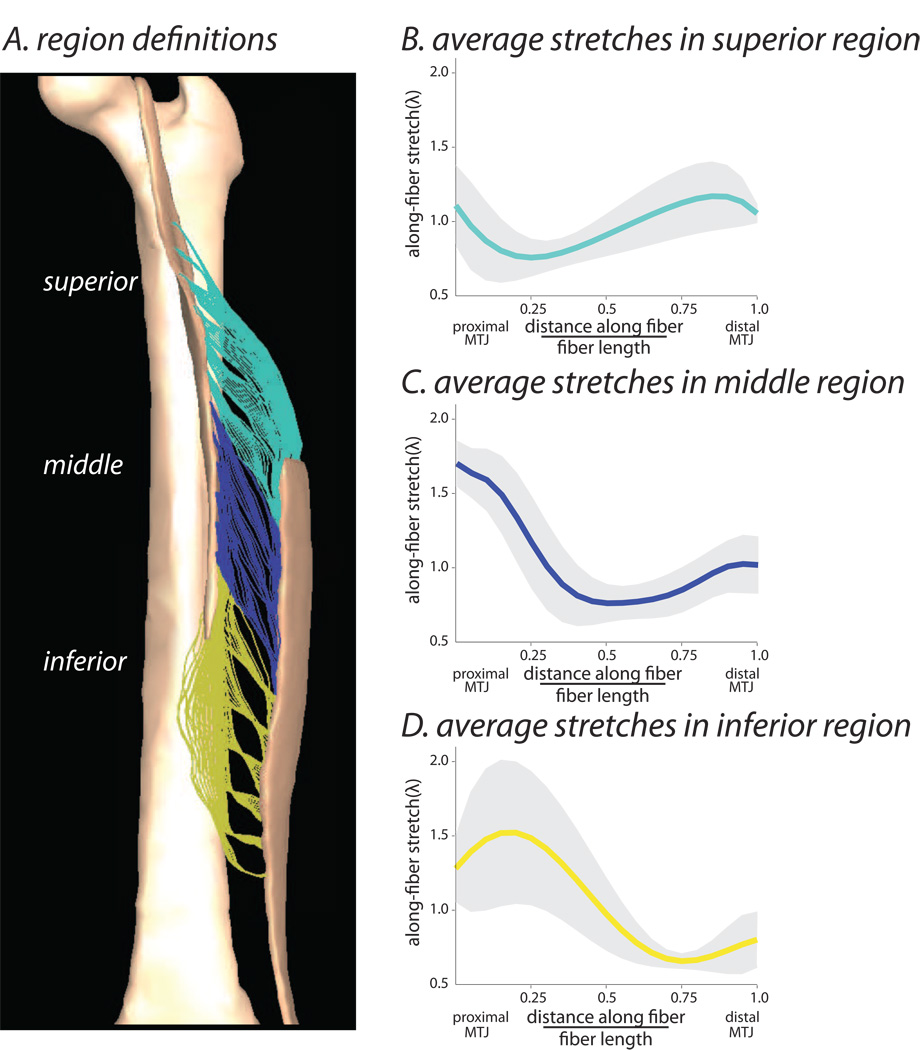
Figure 4.
Regional BFLH stretch distribution, analyzed for representative fibers across the muscle. In order to quantify the stretch distribution across fibers throughout the whole muscle volume, the muscle was divided into three separate regions: superior, middle, inferior (A). We calculated the along-fiber stretch distribution along the representative fibers within each region in the model. The average (± one standard deviation) along- fiber stretch for each region was plotted vs. the normalized distance along the fiber (B–D).

