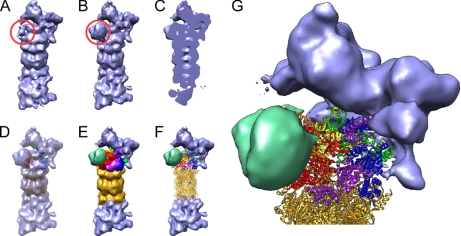
Fig. 3.
Cryo-EM density map of D. melanogaster 26S proteasome. A, image classification revealed that ∼50% of all analyzed particles lacked an additional density (red circle). B, the remaining 50% possessed an additional density (red circle). C, side cut of density depicted in B. D, atomic models of the CP (gold) and the AAA-ATPases (Rpt1/Rpt2/Rpt6/Rpt3/Rpt4/Rpt5, red/orange/yellow/green/blue/purple) fitted into map B. E, segmentation of B according to the fitted atomic models. F, hybrid representation of the 26S proteasome by atomic models and the cryo-EM density where interpretation on the atomic level is not possible yet. G, enlarged view of F.

